


Devices
50 included
(+$2 per extra, up to 1,000)
From 1 to thousands
(custom fee)
From 1 to thousands
(custom fee)
Dots (in/out)
10M / month
6 months retention
$5 per million in
$0.1 per million out (API)
$0.05 per million out (synthetic vars)
Custom capacity
24 months retention
Custom capacity
24 months retention
Throughput
6 dots/s
(up to 3x burst every hour)
20 dots/s
(up to 3x burst every hour)
100 dots/s
(dedicated cloud for >100 dots/s)
Events
1,000 executions incl.
($10 per million extra)
Custom
Custom
UbiFunctions

1,000 executions incl.
($5 per million extra)
Custom
Custom
Email / SMS Alerts
End Users
Up to 5
From 1 to thousands (custom fee)
From 1 to thousands (custom fee)
Organizations
Up to 5
Custom
Custom
Admin Users
1
10
10+
Support
Community
Standard
24h response + Technical Account Manager
Key Extras
Dashboards, basic alerts, user mgmt
Custom branded app, multiple apps, advanced plugins
Private deployment, SSO, SLAs, full customization

Manage devices, variables and historical data


Device organization & fleet management
Custom API rate limits

Dynamic dashboards
Dashboard layers
Essential widgets & plugins
Advanced widgets & plugins
React.js in the HTML Canvas widget
Preset dashboard filters
Dashboard pages
Device layers
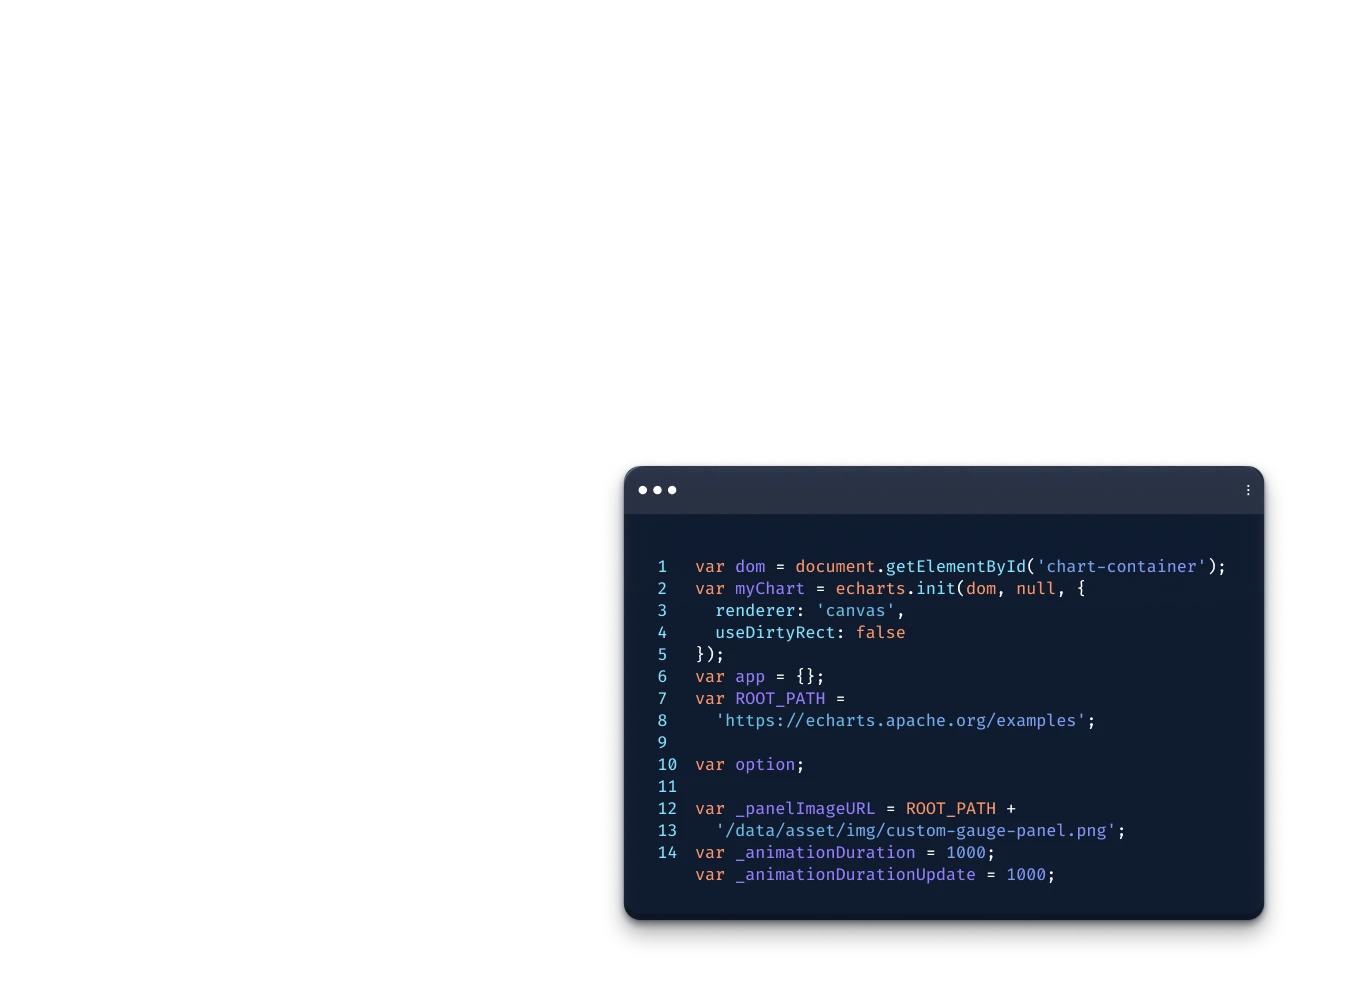
ECharts configuration
Multiple devices dashboards
Widget Plugin

Synthetic variables & data transformations
AI-accelerated UbiFunctions
Scheduled reports & report management
Anomaly Detector
File storage API
Global properties
Test environment
Machine Learning runtimes
Data pipelines

White-labeled Apps (custom-brand our platform)
(Available as add-on)
(Available as add-on)
(Available as add-on)
Manage organizations & end users
Tags for users
Manage device groups & reports as an end user
Contact methods for end users
Custom-branded apps
Remove "Powered by Ubidots" badge
Advanced UI customization
Text rules
Admin users
White-labeled mobile app
Delegated user & organization management
White-labeled API

Event logic & alert automation
Events with dynamic thresholds
Global events

2FA
Two-Factor Authentication for admin and end users
Advanced security & access control
Audit logs
Compliance certifications or audits

Email & in-app support
Corporate billing & payment methods
Enterprise support & service levels
Professional services

Google Tag Manager
OAuth 2.0

Detect wear signs and potential faults in rotating equipment using vibration sensors at high-sampling frequencies.
All Plans

Enhance your brand presence with custom logo, domain, and colors.
All Plans
Devices
50 included
(+$2 per extra, up to 1,000)
Dots (in/out)
10M / month
6 months retention
$5 per million in
$0.1 per million out (API)
$0.05 per million out (synthetic vars)
Throughput
6 dots/s
(up to 3x burst every hour)
Events
1,000 executions incl.
($10 per million extra)
UbiFunctions
1,000 executions incl.
($5 per million extra)
Email / SMS Alerts
100 email alerts incl.
($2 per 1,000 extra)
10 SMS/Voice alerts (country-
based pricing)
End Users
Up to 5
Organizations
Up to 5
Admin Users
1
Support
Community
Key Extras
Dashboards, basic alerts, user mgmt
Devices
From 1 to thousands
(custom fee)
Dots (in/out)
Custom capacity
24 months retention
Throughput
20 dots/s
(up to 3x burst every hour)
Events
Custom
UbiFunctions
Custom
Email / SMS Alerts
Custom
End Users
From 1 to thousands (custom fee)
Organizations
Custom
Admin Users
10
Support
Standard
Key Extras
Custom branded app, multiple apps, advanced plugins
Devices
From 1 to thousands
(custom fee)
Dots (in/out)
Custom capacity
24 months retention
Throughput
100 dots/s
(dedicated cloud for >100 dots/s)
Events
Custom
UbiFunctions
Custom
Email / SMS Alerts
Custom
End Users
From 1 to thousands (custom fee)
Organizations
Custom
Admin Users
10+
Support
24h response + Technical Account Manager
Key Extras
Private deployment, SSO, SLAs, full customization
Manage devices, variables and historical data
Device organization & fleet management
Custom API rate limits
Dynamic dashboards
Essential widgets & plugins
Advanced widgets & plugins
Dashboard layers
Multiple devices dashboards
React.js in the HTML Canvas widget
Preset dashboard filters
Dashboard pages
Device layers
ECharts configuration
Widget Plugin
Synthetic variables & data transformations
AI-accelerated UbiFunctions
Scheduled reports & report management
Anomaly Detector
File storage API
Data pipelines
Global properties
Test environment
Machine Learning runtimes
Delegated user & organization management
Contact methods for end users
Advanced UI customization
Admin users
Manage organizations & end users
Tags for users
Manage device groups & reports as an end user
Custom-branded apps
Remove "Powered by Ubidots" badge
Text rules
White-labeled mobile app
White-labeled API
White-labeled Apps (custom-brand our platform)
Event logic & alert automation
Events with dynamic thresholds
Global events
Two-Factor Authentication for admin and end users
Advanced security & access control
Audit logs
Compliance certifications or audits
2FA
Email & in-app support
Enterprise support & service levels
Corporate billing & payment methods
Professional services
Google Tag Manager
OAuth 2.0
Manage devices, variables and historical data
Device organization & fleet management
Custom API rate limits
Dynamic dashboards
Essential widgets & plugins
Advanced widgets & plugins
Dashboard layers
Multiple devices dashboards
React.js in the HTML Canvas widget
Preset dashboard filters
Dashboard pages
Device layers
ECharts configuration
Widget Plugin
Synthetic variables & data transformations
AI-accelerated UbiFunctions
Scheduled reports & report management
Anomaly Detector
File storage API
Data pipelines
Global properties
Test environment
Machine Learning runtimes
Delegated user & organization management
Contact methods for end users
Advanced UI customization
Admin users
Manage organizations & end users
Tags for users
Manage device groups & reports as an end user
Custom-branded apps
Remove "Powered by Ubidots" badge
Text rules
White-labeled mobile app
White-labeled API
White-labeled Apps (custom-brand our platform)
Event logic & alert automation
Events with dynamic thresholds
Global events
Two-Factor Authentication for admin and end users
Advanced security & access control
Audit logs
Compliance certifications or audits
2FA
Email & in-app support
Enterprise support & service levels
Corporate billing & payment methods
Professional services
Google Tag Manager
OAuth 2.0
Manage devices, variables and historical data

Device organization & fleet management
Custom API rate limits
Dynamic dashboards
Essential widgets & plugins
Advanced widgets & plugins
Dashboard layers
Multiple devices dashboards
React.js in the HTML Canvas widget
Synthetic variables & data transformations
AI-accelerated UbiFunctions
Scheduled reports & report management
Anomaly Detector
File storage API
Data pipelines
Delegated user & organization management
Contact methods for end users
Advanced UI customization
Admin users
Event logic & alert automation
Events with dynamic thresholds
Global events
Two-Factor Authentication for admin and end users
Advanced security & access control
Audit logs
Compliance certifications or audits
Email & in-app support
Enterprise support & service levels
Corporate billing & payment methods
Professional services
Google Tag Manager
OAuth 2.0
Preset dashboard filters
Dashboard pages
Device layers
ECharts configuration
Widget Plugin
Global properties
Test environment
Machine Learning runtimes
Manage organizations & end users
Tags for users
Manage device groups & reports as an end user
Custom-branded apps
Remove "Powered by Ubidots" badge
Text rules
White-labeled mobile app
White-labeled API
2FA
White-labeled Apps (custom-brand our platform)
Detect wear signs and potential faults in rotating equipment using vibration sensors at high-sampling frequencies.
All Plans
Enhance your brand presence with custom logo, domain, and colors.
All Plans



Trusted by Teams
From System Integrators to Fortune 500s, Ubidots empowers
the engineers within to go from zero to hero in no time.








Why Ubidots
Building an IoT application that both works and looks nice can take thousands of engineering hours, so we did it for you.
Data ingestion


Time-Series storage

Alerts / Rules Engine


Alerts Delivery


Dashboards & Reporting

Cloud functions



Features
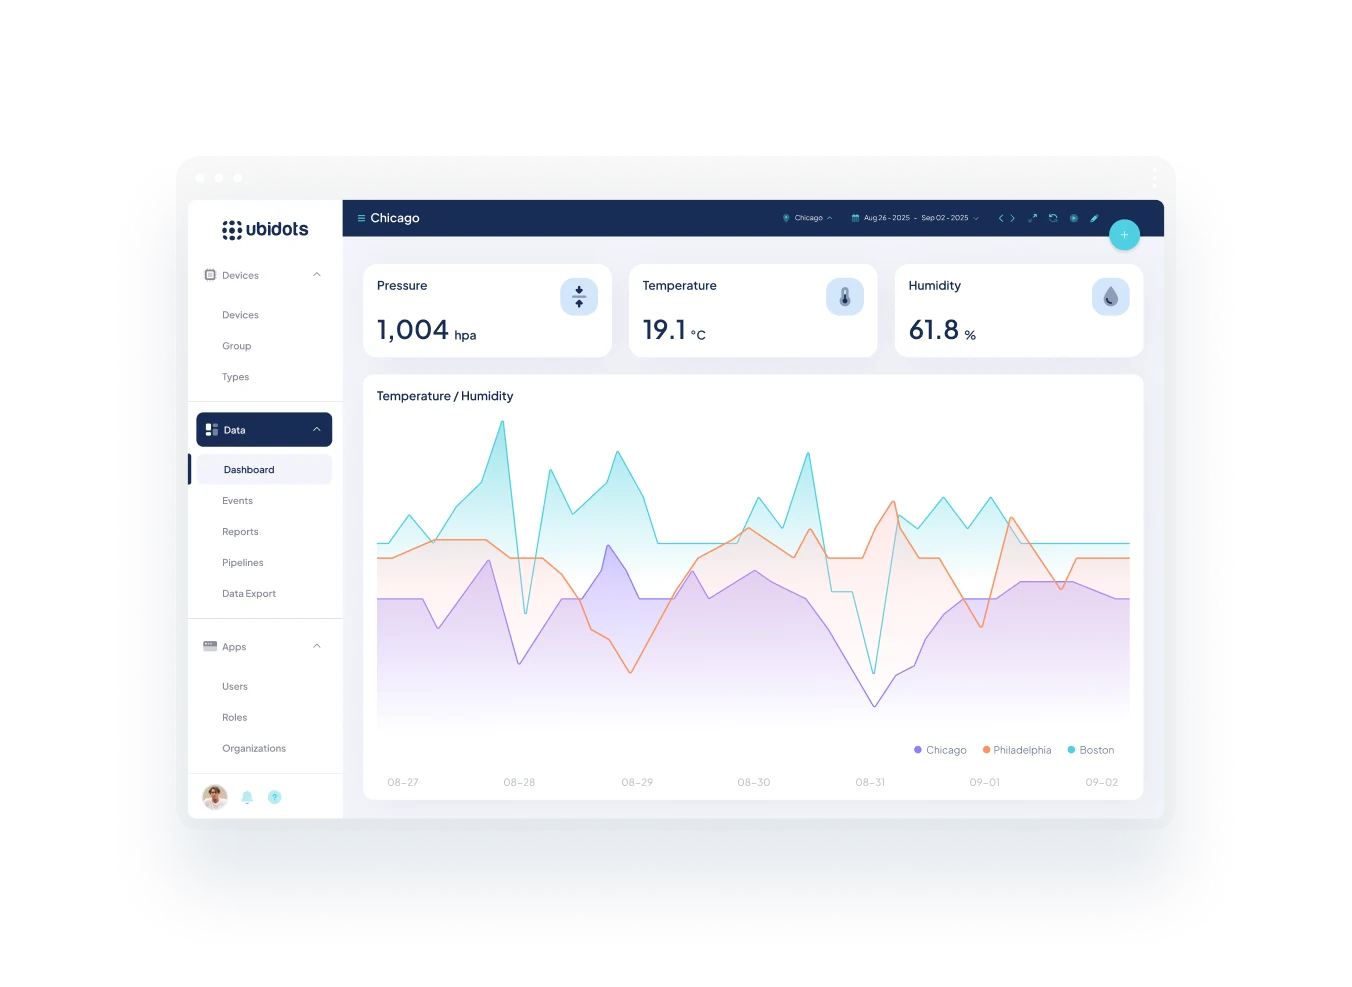
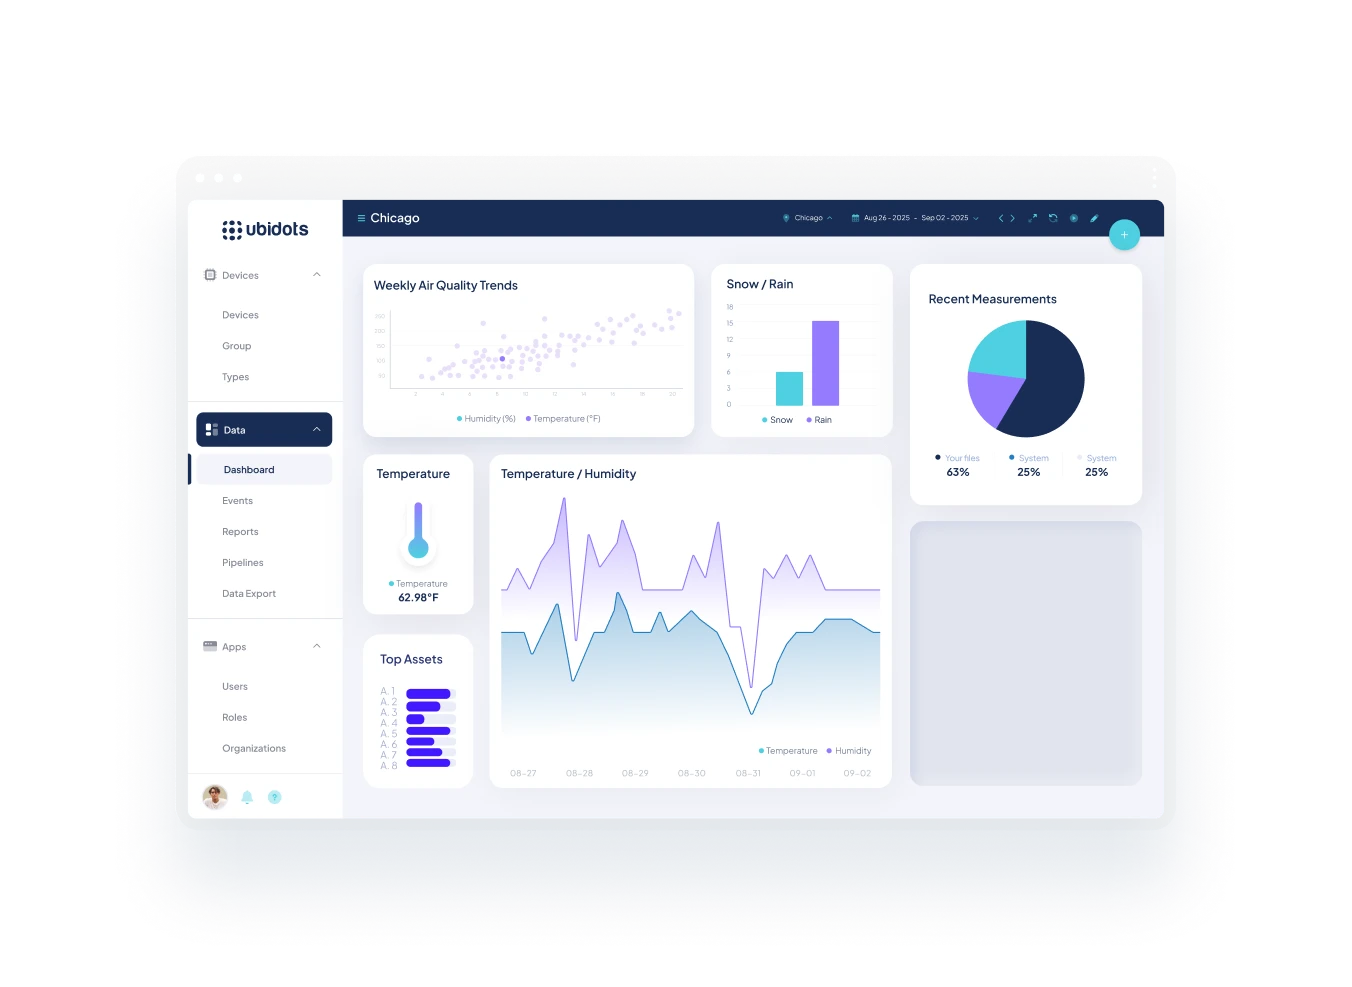
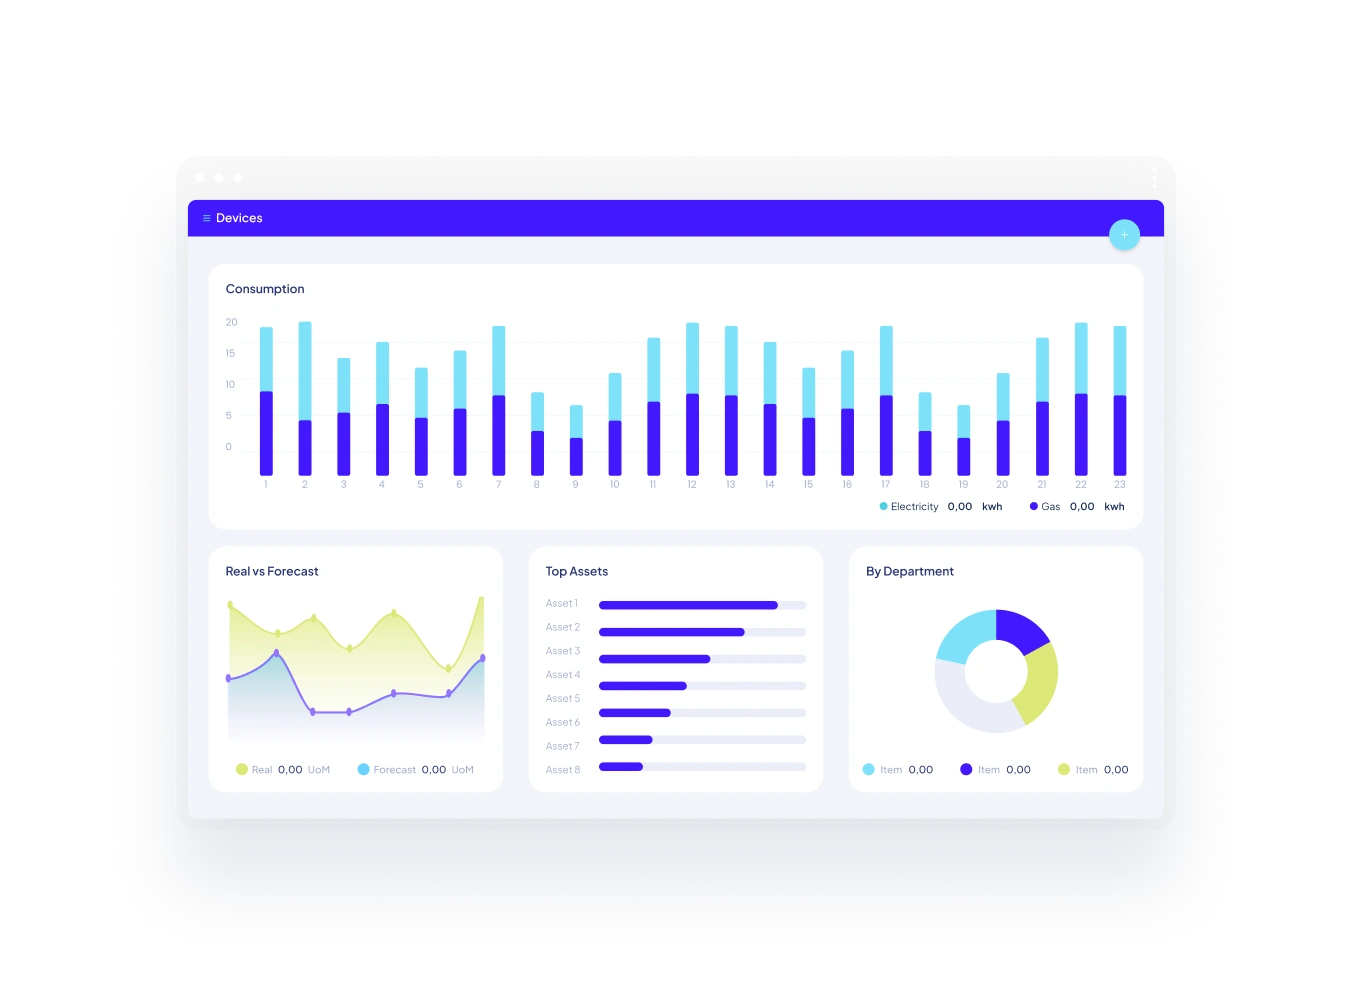
With real-time dashboards and intelligent automation, Ubidots helps you move faster, operate smarter, and scale with ease—saving time, reducing costs, and staying ahead of issues.



Help & Support

Every time a device updates a sensor variable, one data point or "dot" is created. For example, if you have a weather station with 4 sensor variables being updated every 10 minutes (i.e., temperature, humidity, pressure, and rain), then your device will generate 4 dots x 6 times/hour x 24 hours x 30 days = 17,280 dots per month, which fits perfectly into most plans.
Yes! This is a virtual limit in our system. Devices with more than 20 variables are counted as more than one device. For example, if you have a single weather station sending data to 35 variables, then it would be counted as 2 devices.
If you have any paid license, you might create as many Syntethic Variables as needed. Just keep in mind that once you exceed the 20 variables, the device count might be increased based on our 1 device = 20 variable, as well as the dots count.
No, we are a 100% software company and our magic starts once your data reaches Ubidots. Hardware selection, firmware development, installation, and maintenance are typically the scope of our own users. You may find some inspiration in our integrations docs.
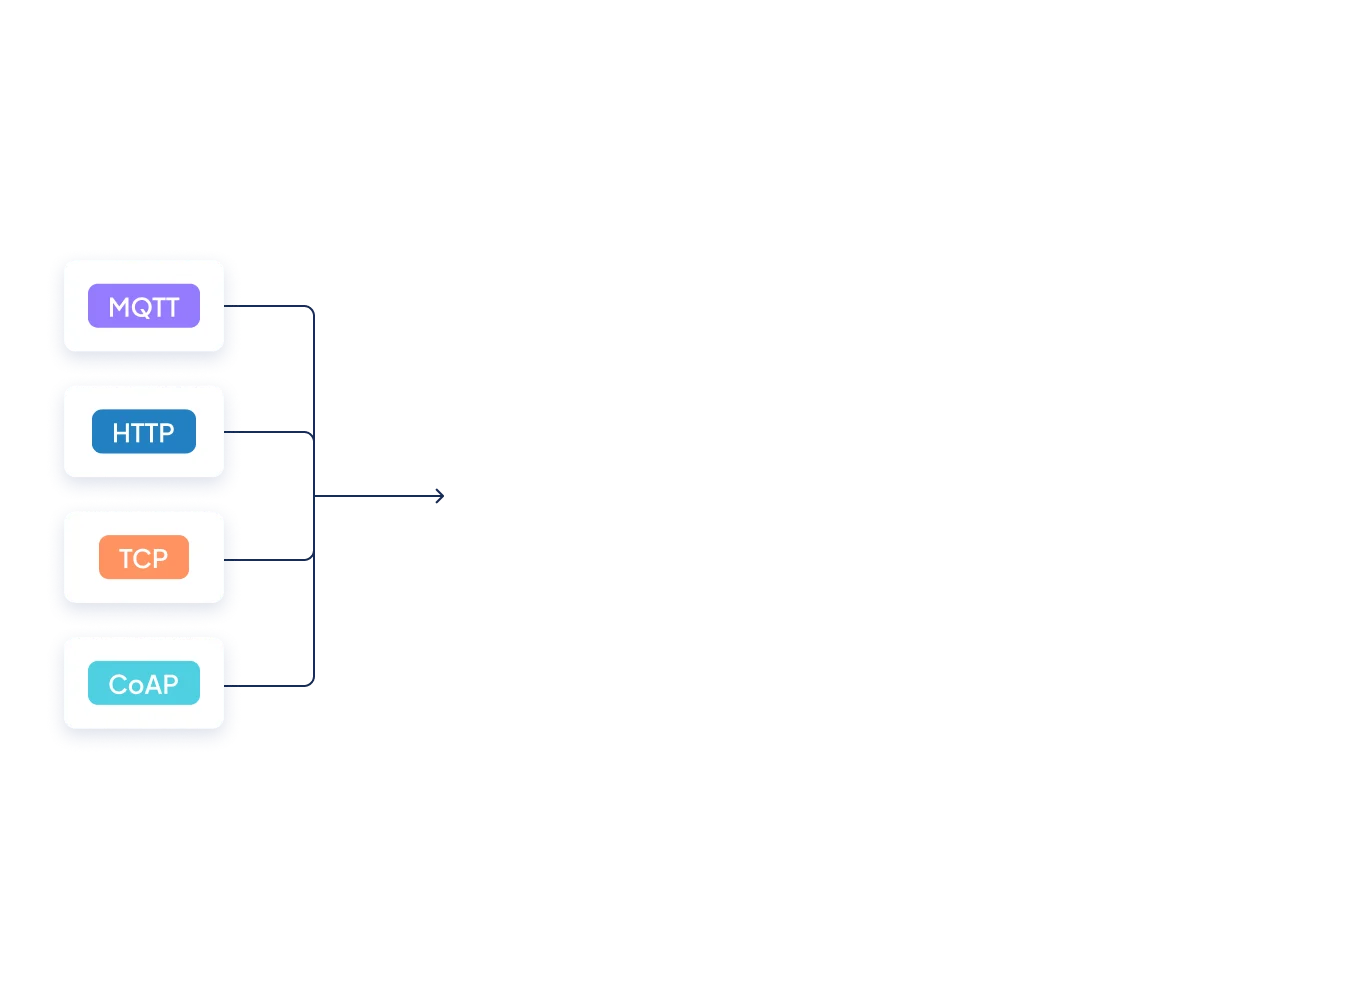
No worries! Your device can talk to Ubidots as long as it has Internet access, and speaks HTTP, MQTT or TCP/UDP protocols. Check out our Data Ingestion API docs to learn more.Our integration guides are just a way to help potential users understand how to send data to Ubidots and should not be taken as an official integration. These guides are provided AS-IS; as a software company we can’t provide hardware support should any of our guides fail to run on your devices.
For general questions and troubleshooting around our Data API, please visit our community forum, or send a note to support@ubidots.com.For custom development, please contact our enterprise team enterprise@ubidots.com.
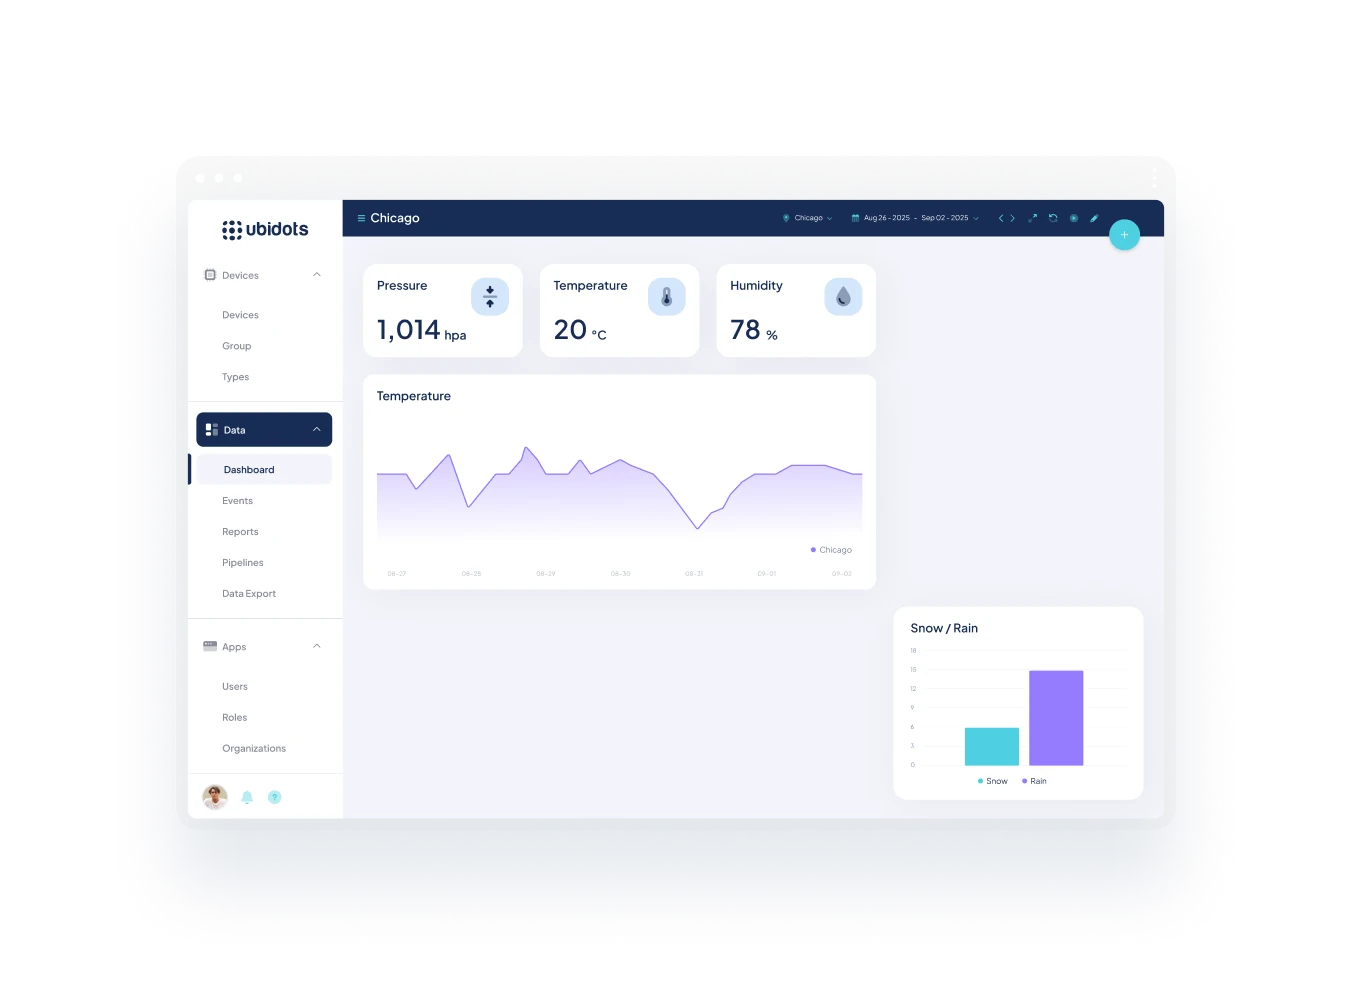
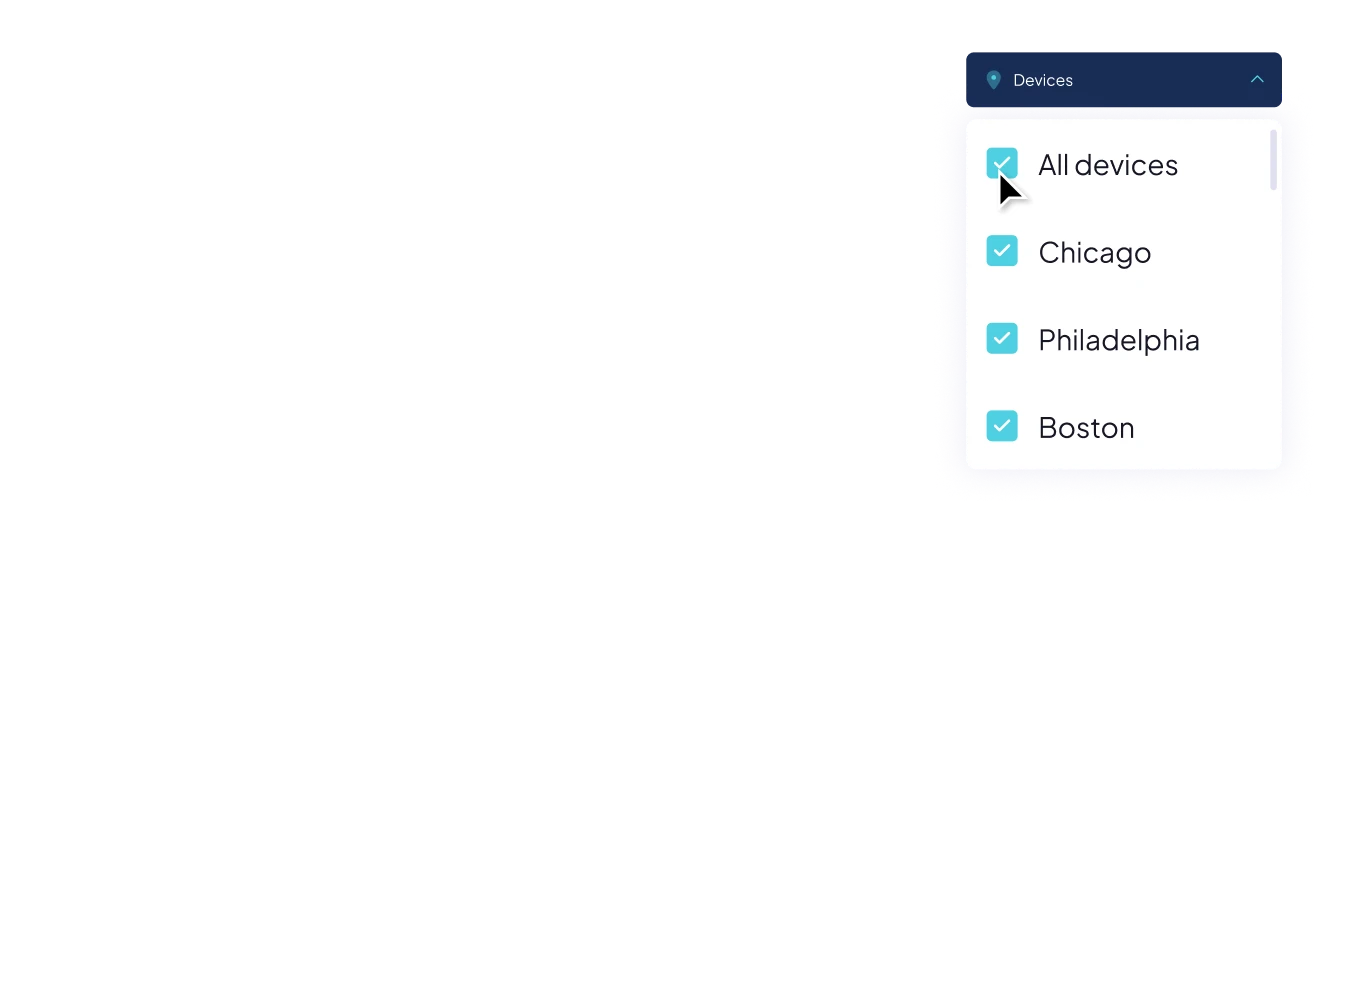
Yes. Ubidots dashboards display live sensor data as it arrives, with instant updates across all connected widgets. You can monitor multiple devices simultaneously in a single dashboard — comparing readings side by side, aggregating values across a fleet, or switching between devices dynamically using built-in device selectors and filters.
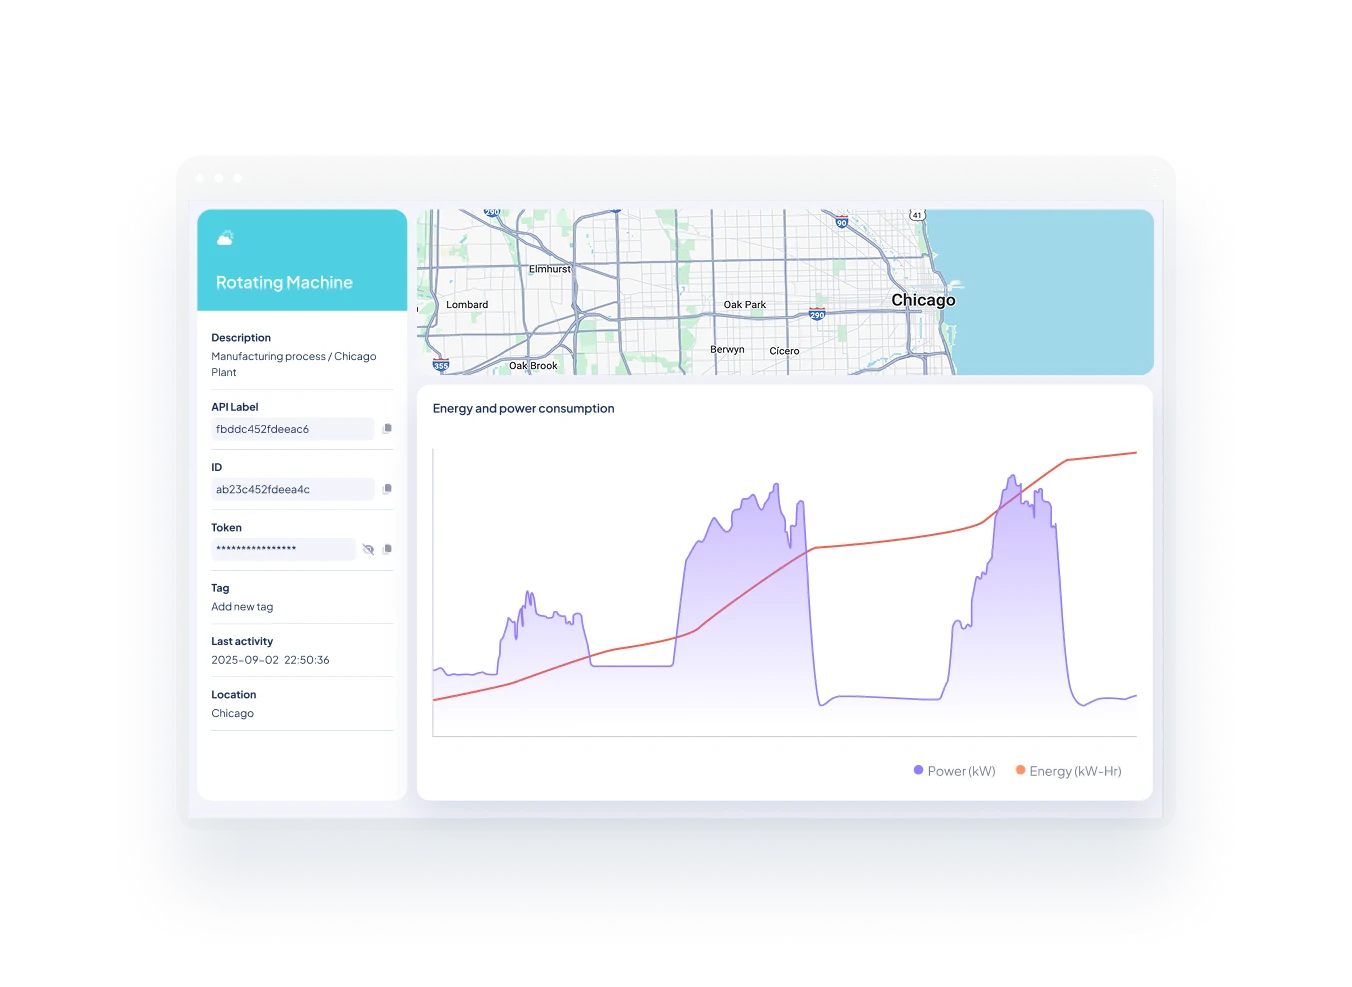
Ubidots supports vibration-based condition monitoring for detecting bearing failures, shaft imbalance, misalignment, and mechanical looseness. Using time-domain analysis, you can apply moving average algorithms via Ubidots' Events engine or UbiFunctions to flag deviations from a machine's normal vibration baseline. For frequency-domain (FFT) analysis — useful for isolating specific fault frequencies — Ubidots offers a dedicated plugin for NCD predictive maintenance sensors that converts raw triaxial acceleration data into amplitude-frequency spectra, visualized through the Frequency Chart widget. This makes Ubidots a practical platform for condition-based monitoring of rotating machinery in manufacturing, oil & gas, and utilities.
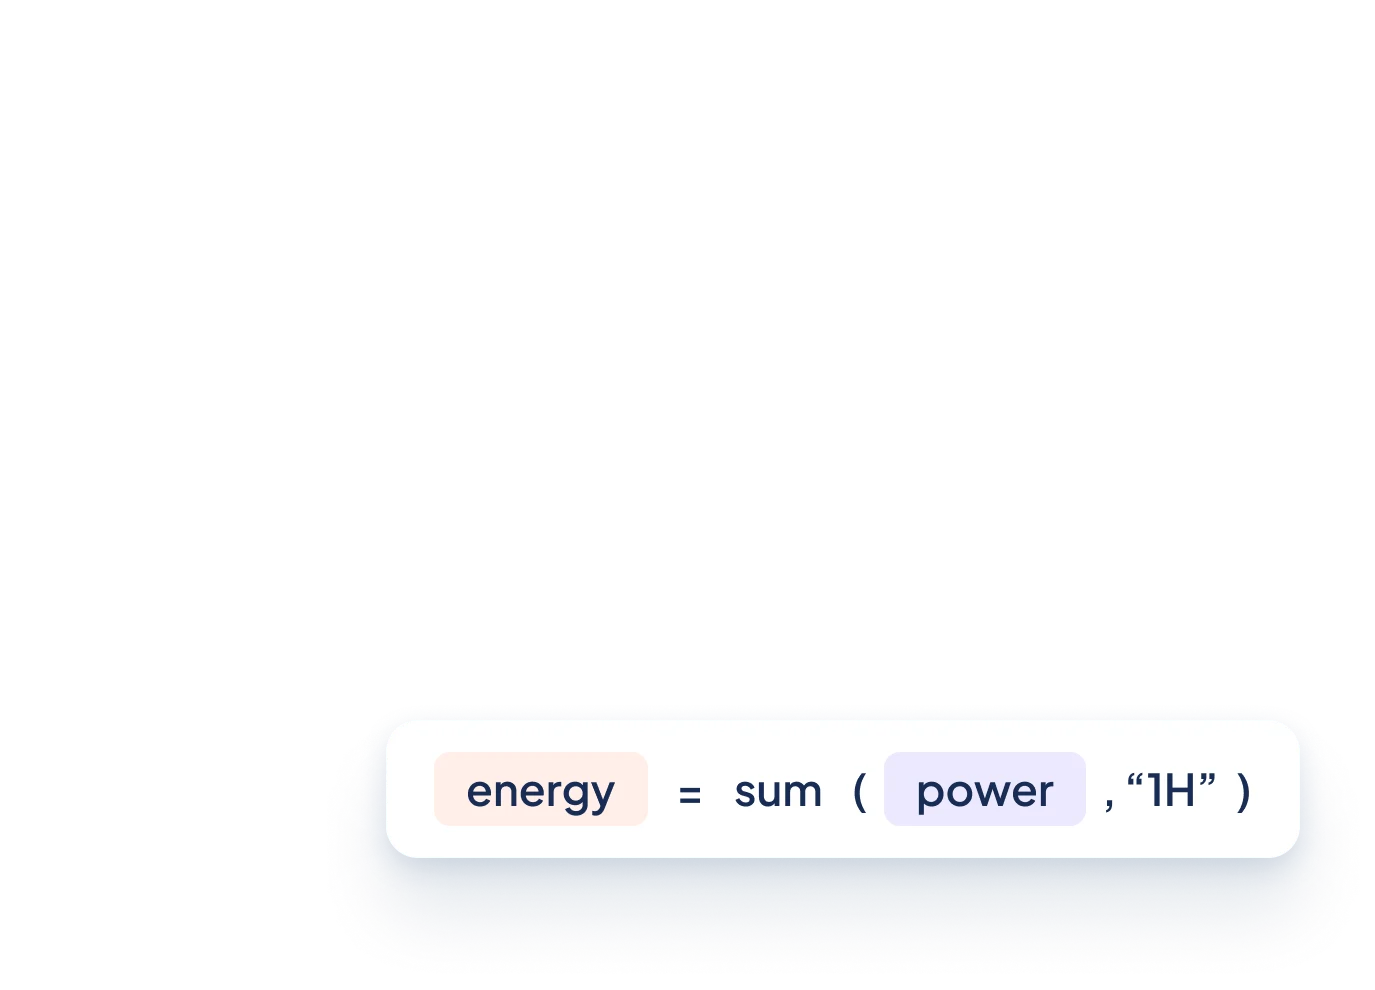
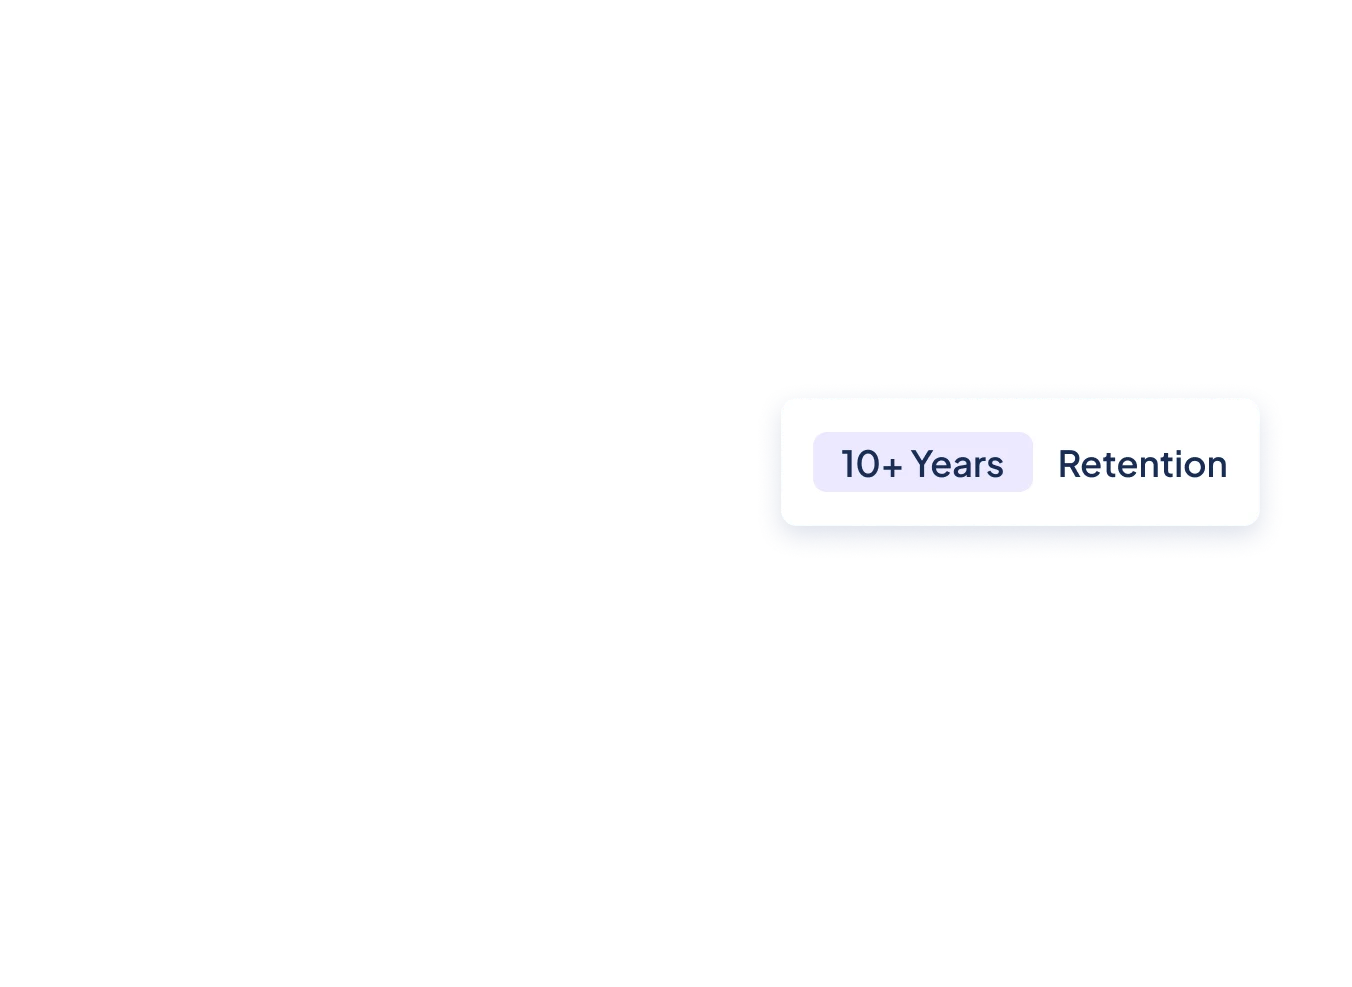
Ubidots can track the metrics that power consumption-based and subscription revenue models — runtime hours, cycle counts, energy consumption, or any other operational variable your pricing formula depends on. Using synthetic variables, you can build cumulative counters that accumulate readings over time and reset on billing cycles, without writing backend code. These values are accessible via the Ubidots API, so they can feed directly into your billing system or be surfaced to end customers on a white-labeled dashboard. Long-term data retention (10+ years) also means historical usage records are always available for dispute resolution or audits.
We offer +20 visualization widgets ready to use. This wide array will allow you to easily configure your own dashboards based on your IoT solution's logic.
You can also code your own widgets by using our HTML Canvas widget We can also code custom widgets for users under Enterprise licenses.
For custom development, please contact our enterprise team enterprise@ubidots.com.
Yes. We have a mobile app for owners and admin users available in Android and iOS. On the app you can easily explore your devices, quickly see the last values of each device's variable, navigate the historical data of each variable, and view your web dashboards. In the future, receiving Ubidots' Event triggers as phone notifications will be added.
Enterprise plan holders can extend the app to their end users by white-labeling it on demand. To do this, contact us at sales@ubidots.com.
Because high-frequency vibration sensors can generate far more data points per second than IoT platforms can ingest as individual readings, Ubidots uses a context-array approach: raw vibration samples are packed into an array at the edge (e.g., via a Node-RED function node) and sent as a single payload stored in a variable's context field. The Frequency Chart widget then reads that array to render the full spectrum — no data is lost, but the architecture requires edge pre-processing rather than point-by-point streaming. UbiFunctions, Ubidots' serverless Python environment, can then process these arrays to compute FFT outputs, RMS values, or run ML inference on demand or on a schedule. Note: the Frequency Chart widget requires an Industrial license or higher.
Yes. Ubidots offers a white-label add-on that can be purchased separately, giving you a fully branded portal with a custom domain, logo, and color scheme, plus an app builder for layout and navigation. Each customer organization is isolated with its own access scope, so a customer only sees their own equipment. Role-based access control lets you define what each user role can view or configure within that organization. The result is a branded portal your customers log into directly, with no visible reference to Ubidots — which is particularly valuable when the monitoring experience is part of the service contract you're selling.
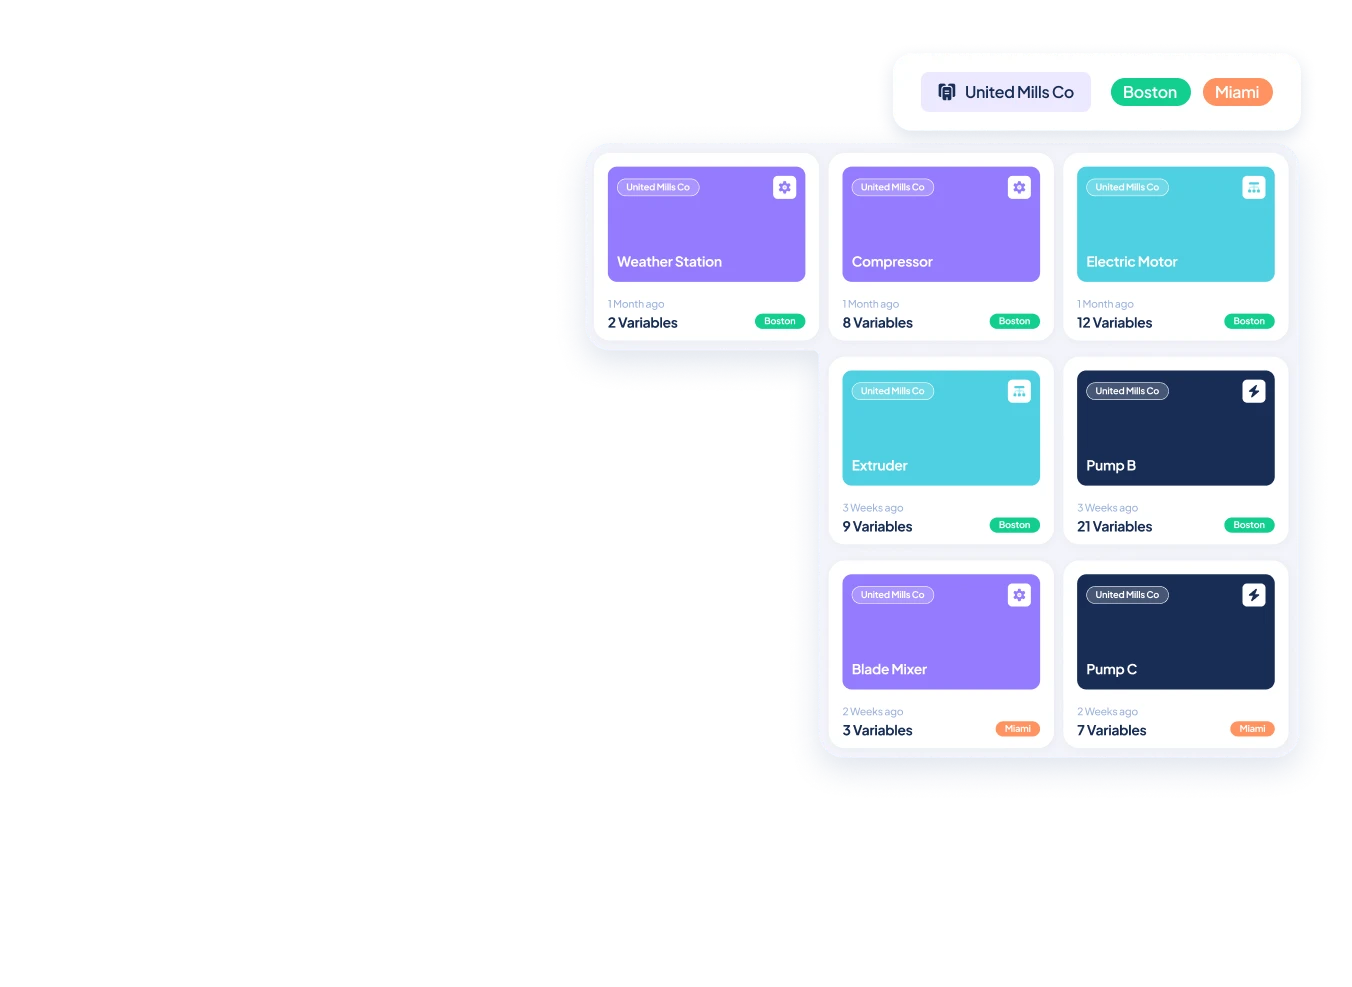
You don’t have to buy multiple licenses for each prospective client. Ubidots operates under the “One-license, multiple customers” model. Using our Organizations module available from the Professional license and above, you’ll be able to create many entities containing Devices, Dashboards, Events, Tokens, and End-users. Learn more.
Yes, you can. Every license over the Industrial plan includes one App (white-labeled portal). If you want multiple white-labeled domains, you can pay it as an overage of $149/month. Check out these articles for more information about the white-label Apps and End-user management.
Yes. Ubidots' UbiFunctions lets you deploy Python-based ML models in a serverless cloud environment — no external servers required. You can schedule a function to run hourly, fetch recent vibration or sensor data via the Ubidots API, run inference, and write predictions back as synthetic variables on the platform. Those variables can then trigger automated alerts through the Events engine when a fault probability exceeds a threshold. This workflow works best when you have labeled historical data that includes failure events; the platform doesn't generate training data automatically, so data quality directly determines model accuracy.
Ubidots' multi-organization architecture lets you create isolated environments for each customer, each with its own devices, dashboards, users, and alert rules — all managed from a single provider account. Device Types let you define a standard equipment configuration once and replicate it across the entire fleet, so onboarding a new customer account is a repeatable, low-effort process. Groups and tags let you filter and segment assets across customers for fleet-wide reporting, while role-based access control ensures customers never access each other's data.
Ubidots self-service IoT licenses are hosted on AWS' Ohio data center (us-east-2), by default.
We can also deploy a private instance in the AWS, GCP, IBM, or Azure data center of your choice, under an Enterprise license. Fill out this form to request a custom quote under an Enterprise plan.
Additionally, Ubidots has an Australian deployment hosted in AWS. This is offered and supported by an Ubidots authorized distributor, invoiced locally in AUD. Reach out to sales@ubidots.com to request more information.
Yes, under an Enterprise license you can request a private cloud managed deployment in the AWS, GPC, IBM, or Azure data center of your choice, and preferred location. Private clouds are quoted on demand on top of an Enterprise license.
For a private cloud quote development, please contact our enterprise team enterprise@ubidots.com.
No, as a Cloud-based product, you can’t install it on a local server. Private deployments only work on a cloud level as dedicated Ubidots deployment, managed by our DevOps team, in the AWS data center of your choice.
Our default uptime policy is “best effort”. You can check our historical uptime in our status page.
We offer 99.5% or 99.9% SLAs for our Enterprise clients.
Yes. Using Device Types and Templates, you define a standard vibration monitoring configuration once — variables, dashboard layout, alert rules — and replicate it across any number of assets. For deployments using NCD vibration sensors, Ubidots also supports over-the-air (OTA) remote configuration, letting you adjust sensor parameters like output data rate (50–25,600 Hz) or sampling duration from a central dashboard without local access. A "Global OTA" field enables batch reconfiguration across multiple sensor nodes simultaneously. Data is retained for 10+ years, and role-based access control lets you segment visibility by site or team, which is useful in multi-tenant industrial environments.
Ubidots' Events engine lets you configure condition-based alerts on any variable — threshold crossings, moving average deviations, or inactivity detection — so your team is notified the moment equipment behavior signals a problem. For more advanced degradation detection, UbiFunctions lets you deploy scheduled Python functions that run inference on live sensor data and write a health score back to the platform, triggering an alert before the issue escalates. Combined with 10+ years of historical data, you can also analyze failure patterns over time to identify which equipment types or operating conditions carry the highest risk, and adjust maintenance intervals accordingly.
Ubidots bills within the first 3 days of the month for services rendered in the previous month. For example, on June 1st a user would be billed for services rendered between May 1st and May 31st.
Ubidots sends invoices and executes billing within the first 3 days of the month. If no credit card is on file or billing is not completed within 30 days of invoicing, services are automatically suspended.
All users are emailed an invoice for services rendered in any particular month. Included within this invoice will be the Plan, Dot Count (in millions), Device Count (counted individually), SMS (counted individually), Email (counted in blocks of 1,000), Events (webhooks), Organizations (not billed), Apps (counted individually).
You can also review your day-to-day usage anytime under your account profile.