From Device to Dashboard with AWS IoT and Ubidots
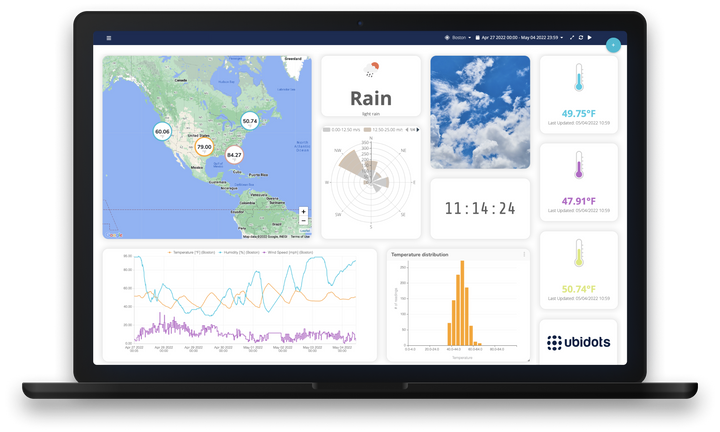
In IoT solutions, dashboards are a vital factor to your user experience. They enable visualization of your data clearly and interactively, allowing for data-driven decisions in real-time.
If you're building an IoT solution for either your company or external clients, you’re likely to face various challenges across the IoT stack: from sensor instrumentation to device and gateway programming, connectivity, and then, of course, do it all fast enough to secure sponsorship. No wonder why building appealing, cross-platform dashboards might become a second priority.
Ubidots has partnered with AWS to provide code-free, real-time, and scalable dashboards designed specifically for IoT applications.
In this article, we will learn how to connect existing AWS IoT devices to Ubidots, and then build a dashboard to display the data. In other words, we are combining the power and scalability of AWS, with the seamless dashboarding service of Ubidots. Lastly, we will share the dashboard with users and collaborators.
Flexible, Drag-n-Drop Visualization for IoT
Hundreds of companies use AWS IoT services for their operations, and rightly so, given the enormous catalog of products and services AWS provides. When adding a visualization layer to your AWS IoT project, you might be tempted to deploy your own EC2 instance, hire a frontend developer, and build a custom UI. However, as with most software development projects, there is a risk it can become an endless pursuit of features that ends in client frustration, lost opportunities, and lots of billable hours.
Another alternative would be to use AWS Quicksight. But even though it is a powerful analytics tool, it does have a few disadvantages when it comes to rapid IoT development:
-
Quicksight is a generic business intelligence (BI) service, which is powerful for some applications (i.e., seeing patient costs across several hospitals, or sales performance in retail stores), but it can fall short when displaying streams of IoT data. AWS aims at visualizing a broad spectrum of data, including, but not specializing in, IoT's.
Ubidots, on the other hand, is a dedicated platform designed to enable you to deploy IoT products and services. From the ground up, every feature is optimized for the needs of connected and scalable IoT products. -
Have you tried to use Quicksight (or any other AWS service)? You will quickly find out how complicated the process can be. All of their services are designed by developers for developers, requiring technical expertise or AWS certifications in order develop applications on top of them.
For its part, Ubidots is a low-code environment where you can build your own white-label portal, dashboards, and alerts, without having to become a software developer in the process. -
Is time-to-market an important variable in your project?
Time to market is one of the biggest success factors in most technology projects. A quick search in Kickstarter will yield many enthusiastic startups who wanted to deploy a product but failed due to wrong estimations of the time to market. Likewise, project managers in IT, OT, or Maintenance, need to demonstrate early results that serve as quick wins to secure larger project budgets.
The power of AWS IoT + Ubidots
What you can do, however, is keep your devices and services in AWS, while forwarding the data to Ubidots, where you can deploy code-free dashboards in minutes.
To start visualizing your data in Ubidots, let’s start by creating an account.
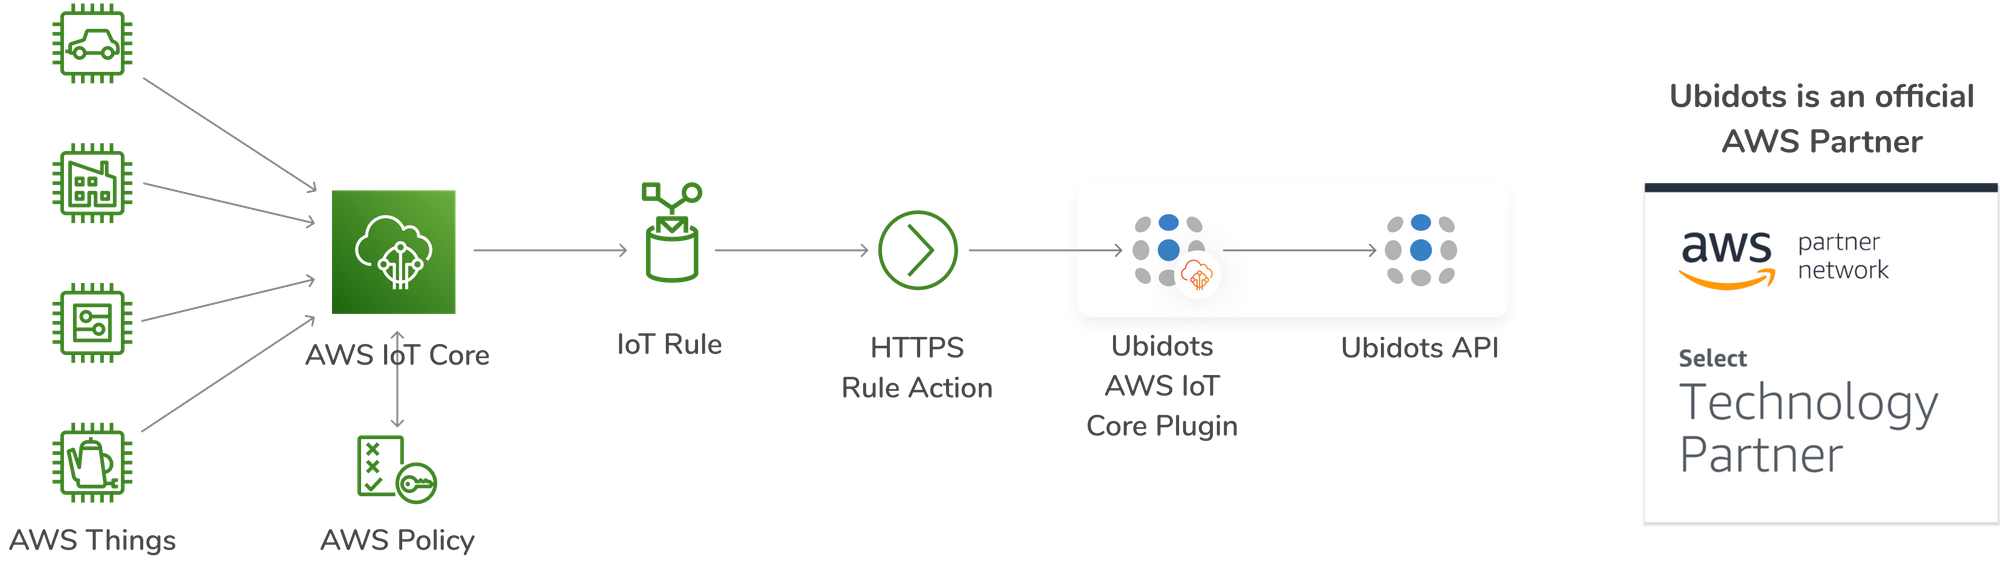
Then, you want to create a secure tunnel through which you can forward data from AWS services to your Ubidots account. Luckily, this process is very easy thanks to Ubidots’ free and powerful integration plugin:
Here is a quick guide on connecting AWS IoT Core to your Ubidots account.
PRO TIP: If you don’t have devices or data in AWS, you can always create devices and send data to Ubidots directly, using our HTTP, MQTT, TCP/UDP ingestion APIs. Also, be sure to check our integration tutorials for known hardware platforms.
The power of Python
As you may have noticed, our AWS IoT plugin is written in Python and exposes a portion of the code where you can decode your AWS IoT data at will. This opens up a world of possibilities, such as:
- Decoding custom data frames: 3rd party devices, where neither the firmware nor the PCB design was done by you, may send custom data frames of bytes that need decoding. Python makes it easy to handle binary-encoded data.
- Shifting dates, timestamps, or changing their formats.
- Apply operations before inserting the data into Ubidots. Some real examples:
- Extracting the FFT (Fast Fourier Transform) from a set of vibration measurements, in order to analyze machine health.
- Extracting the AQI (Air Quality Index) from environmental measurements.
- Use Machine Learning libraries to detect anomalies in your data, and alert possible deviations.
- Use other AWS services through AWS Python library Boto3.
Creating IoT dashboards with Ubidots
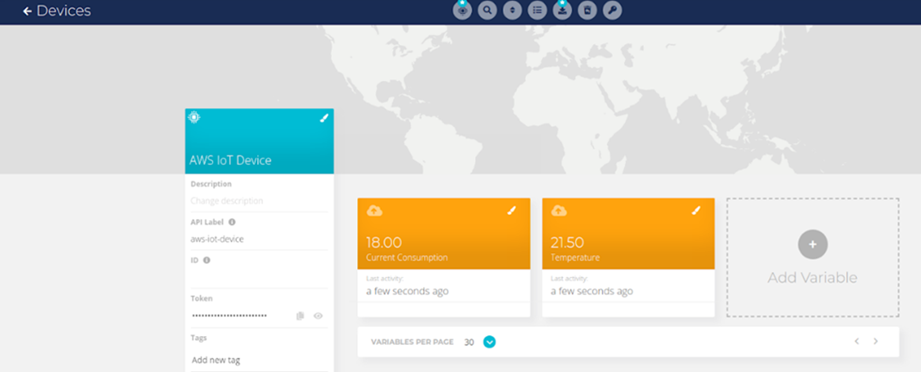
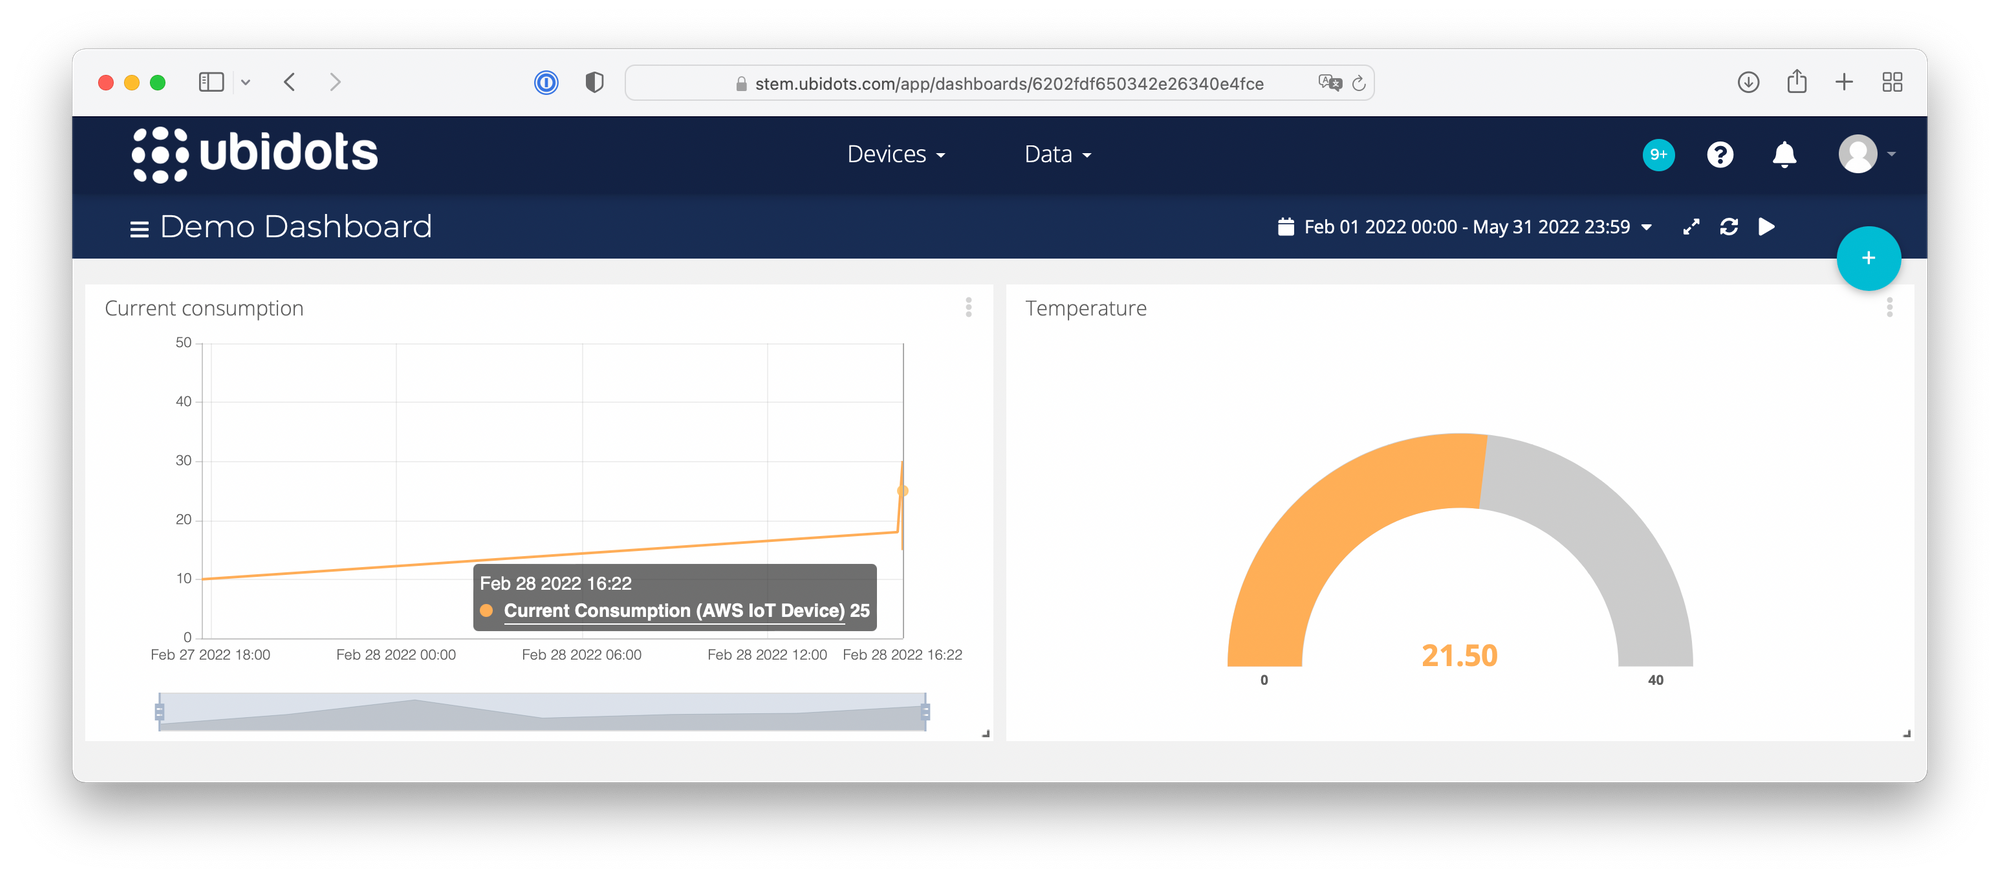
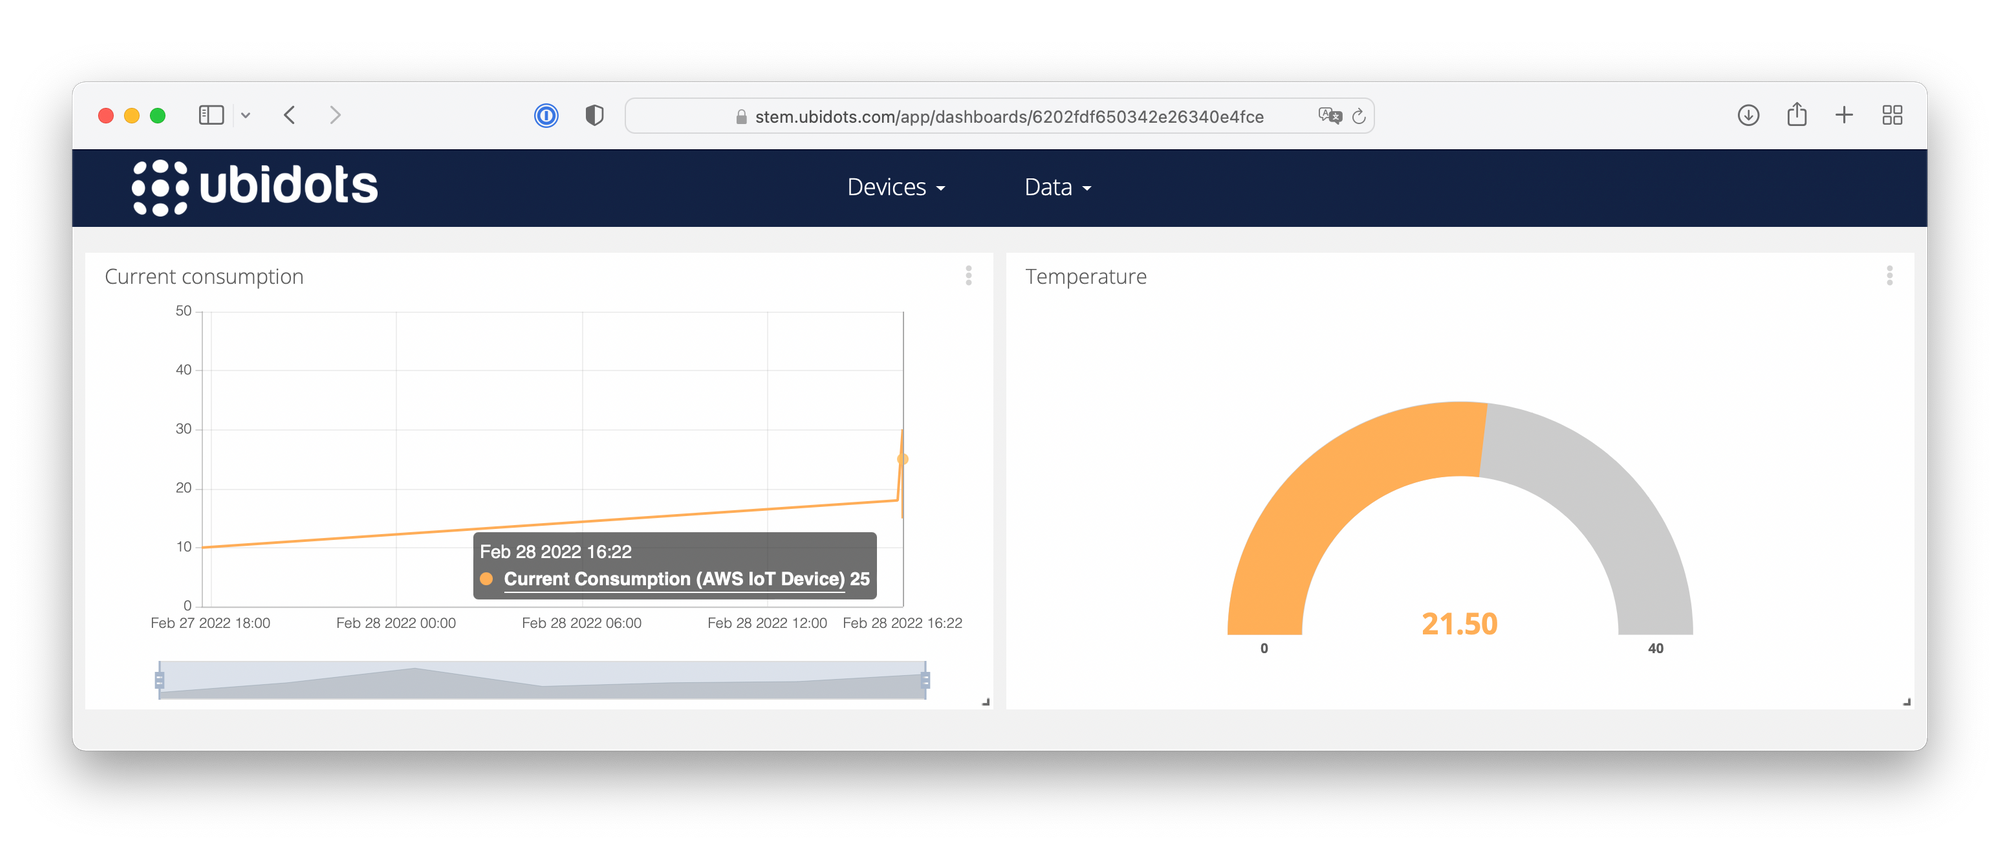
In the example below, I forwarded the data from AWS and created a device called “AWS IoT Device” in Ubidots with the variables “Current Consumption” and “Temperature”. As we can see, their latest values are 18 and 21.5, respectively.
Now we are ready to design our dashboard. In your Ubidots account, go to "Data" and then "Dashboards".
Note: by default, you will be on the Demo dashboard design page.
Step 1: To create a widget, click on the “+” icon in the top-right corner of the dashboard user interface.
Step 2: Select the type of widget from the available options. In my case, I will create a line chart for the Current Consumption variable.
Step 3: Assign a Variable for the widget by clicking the "+ Add Variables” button and then choose one of the variables you’ve set up in your device. In my case, that would be the Current Consumption variable.
Step 4: Configure the widget appearance and save.
Apart from the linear widget, the image below shows a gauge widget I also created to display the Temperature variable data. Both can be further customized in appearance and functionality, and we can set up many more widgets in our dashboard.
As a last step, let’s share our dashboard. To do that, head over to the Dashboards section on the left drop-down menu and select the "share" icon (highlighted in the following image).
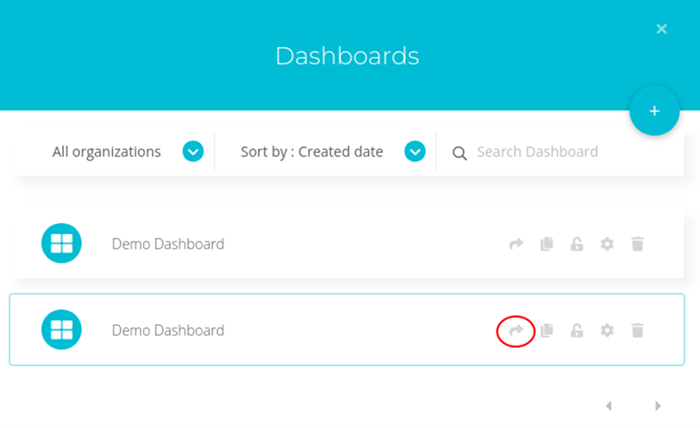
This opens a new menu in which you can create a link for your dashboard. Choose between a version to share or to embed, copy it to your clipboard and then paste it anywhere for you and others to see.
Wrapping up
At this point, you’ve learned how to stream data from AWS IoT to Ubidots, how to create a dashboard in Ubidots and how to share them.
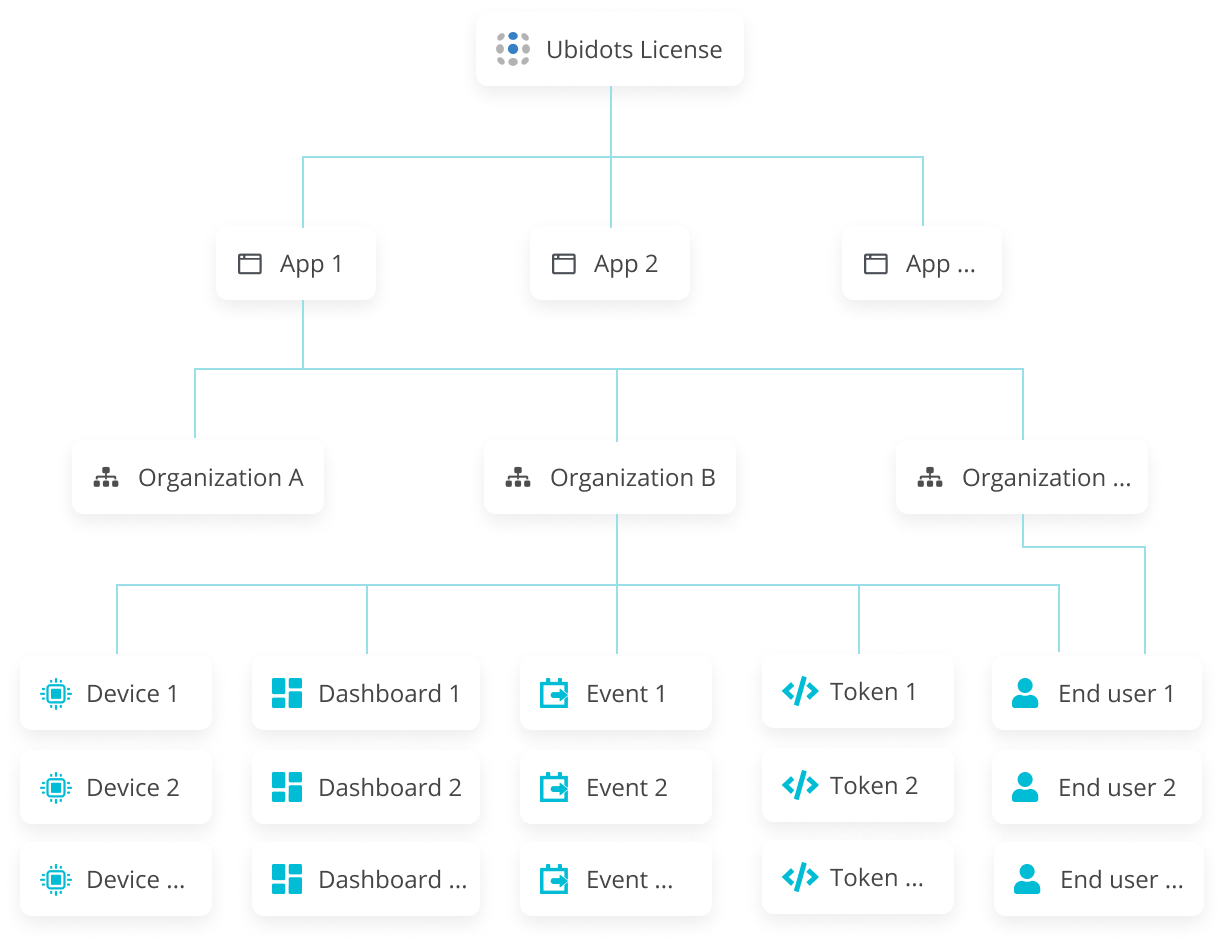
Public links are not the only way to share your visualizations with stakeholders; we also support a more robust set of permissions in order to segment your deployment and give access to different customers. Learn more about Ubidots Apps, Organizations, and End Users.
If you have any questions about designing the dashboard, please refer to our help center and our documentation.
Ubidots is not just a dashboarding service, though, it is a full platform that enables you to build your IoT project, or even an entire IoT business! Thousands of users are already connecting the dots with Ubidots. Ready to jump in? Click this link to get started with Ubidots.